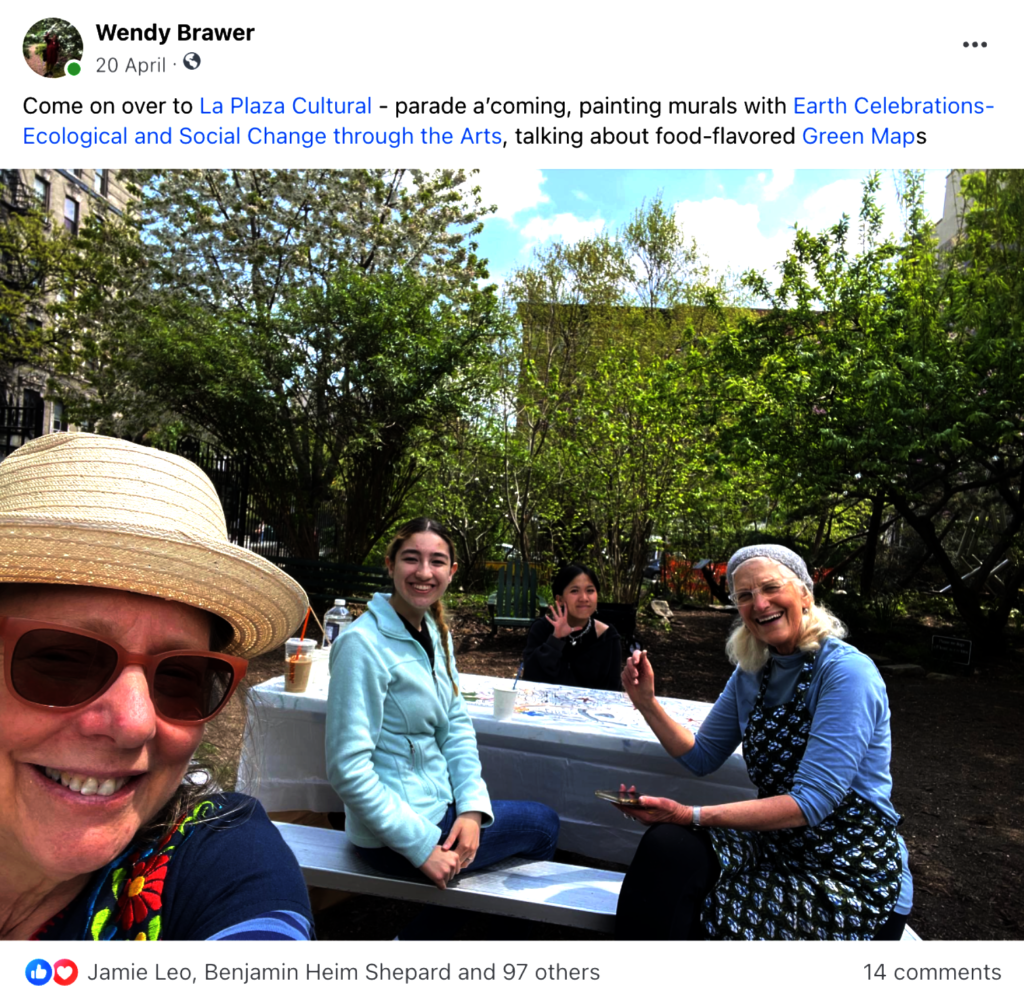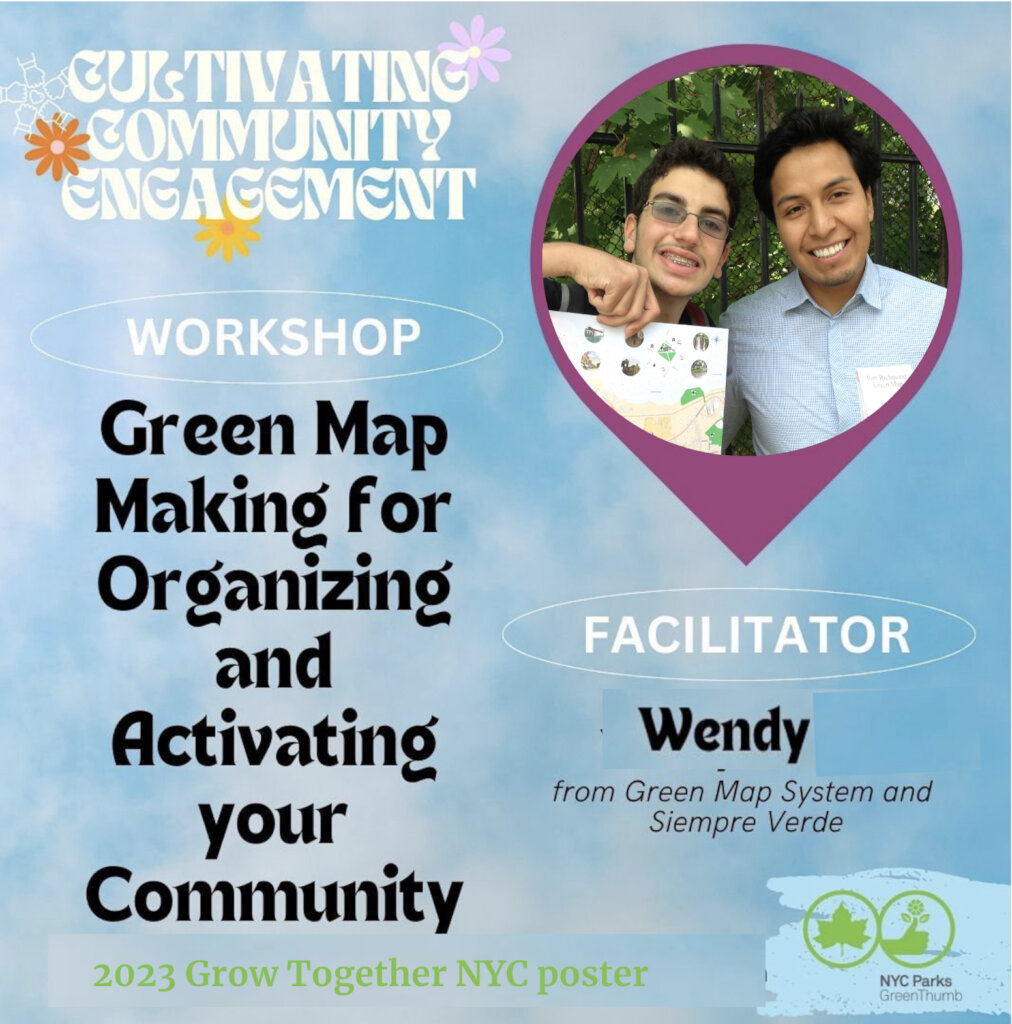
By Wendy Brawer | Director
Dear friends!
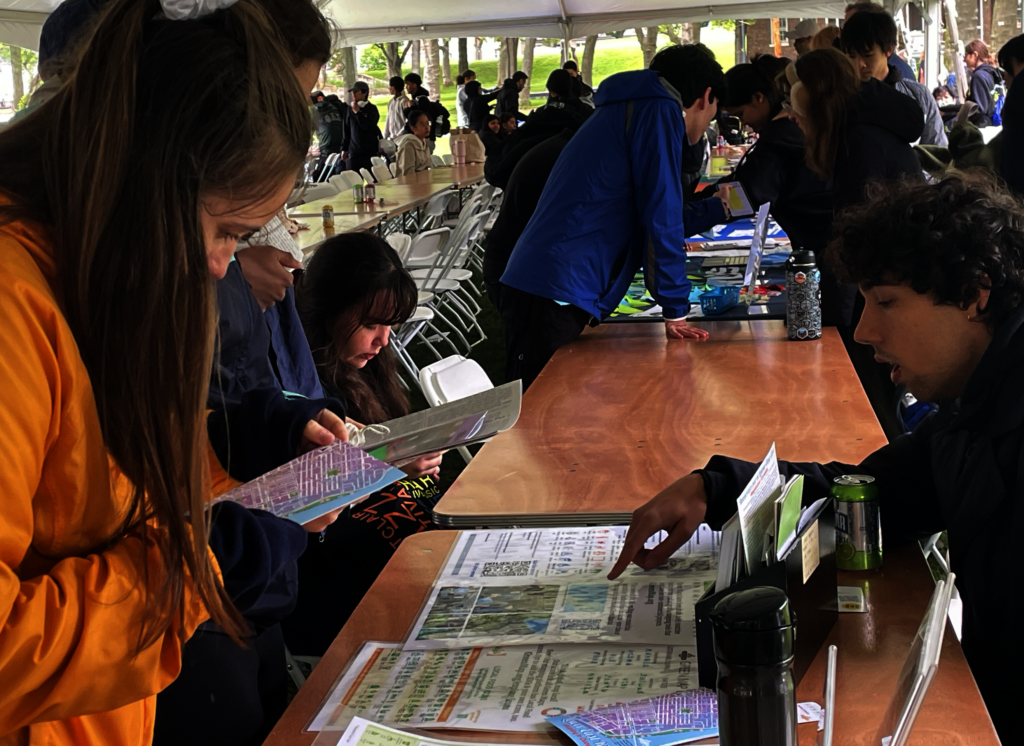
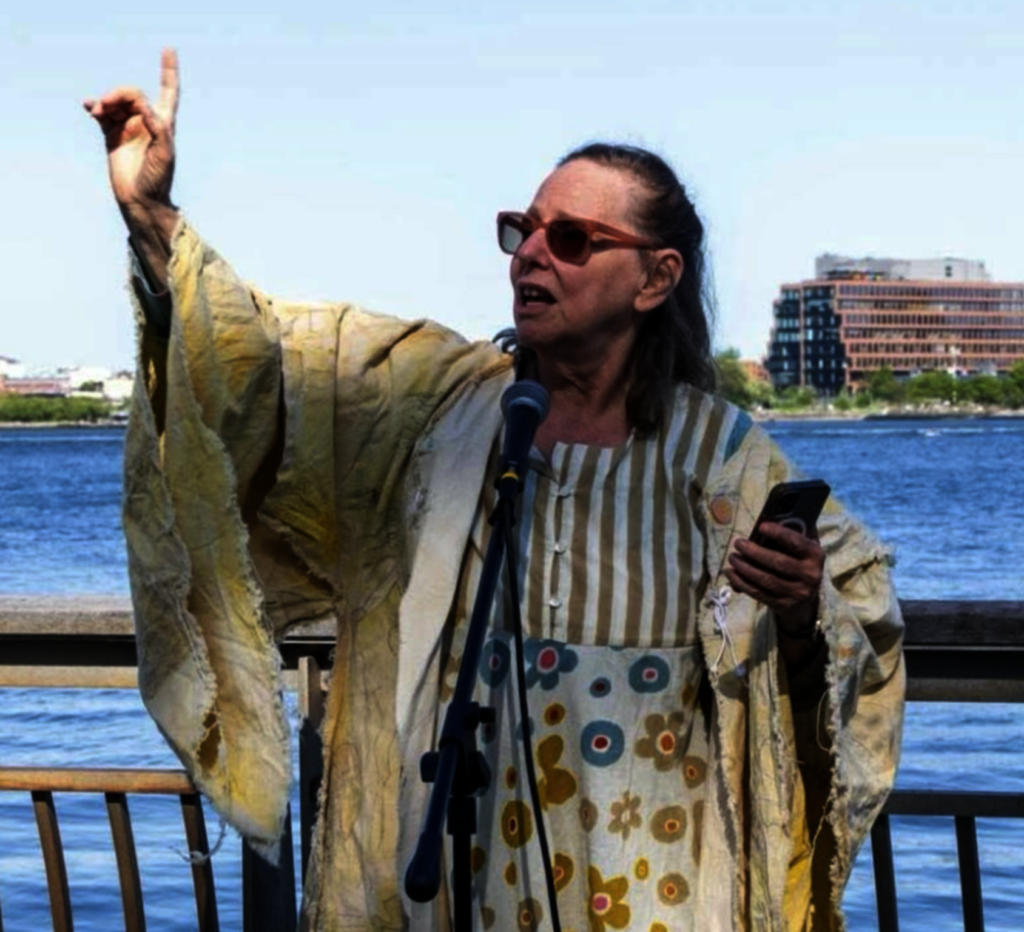
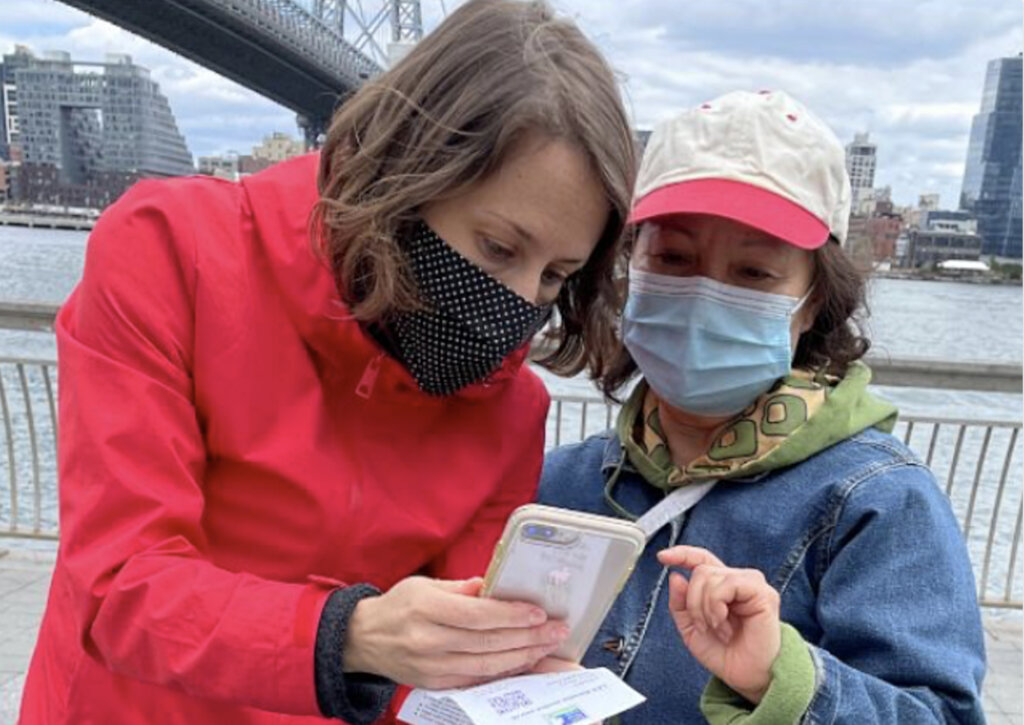
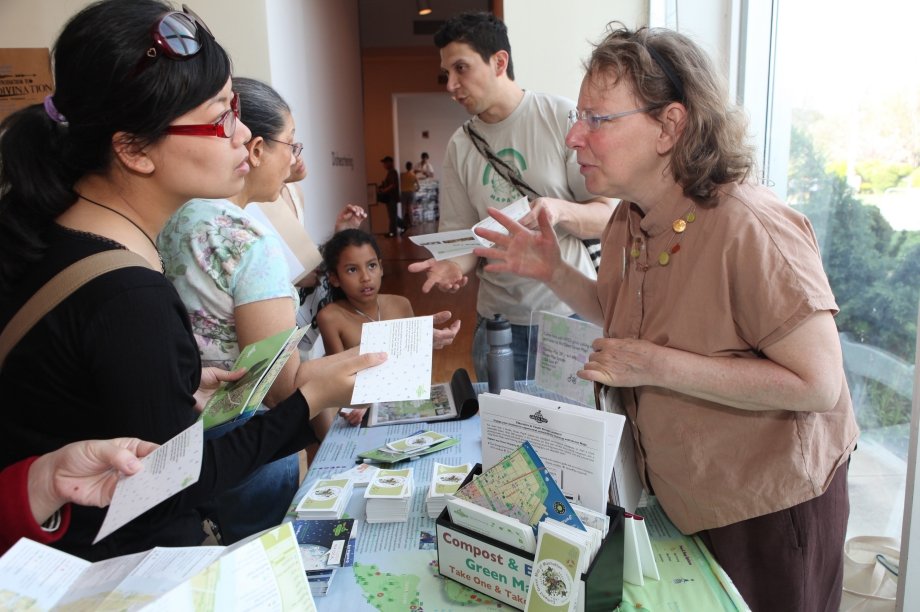
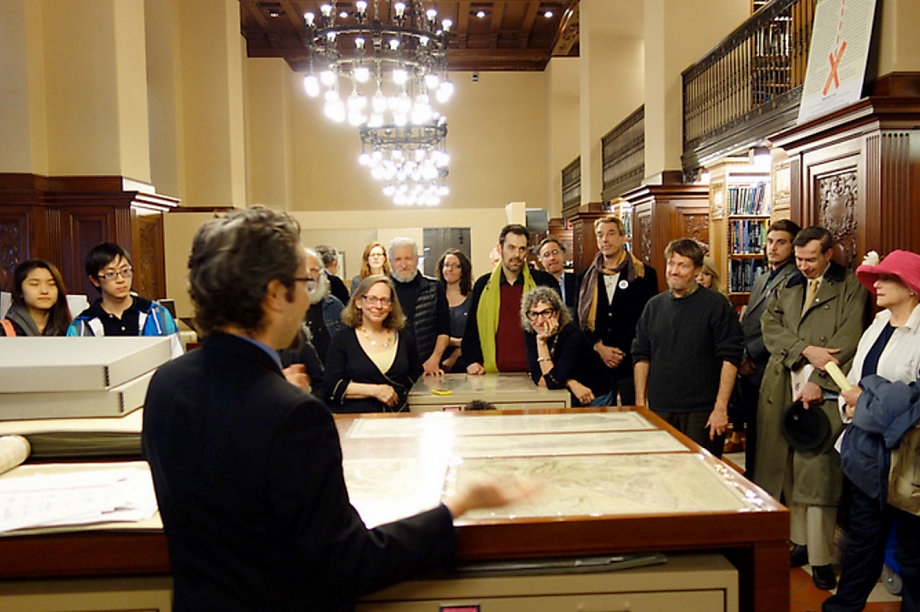
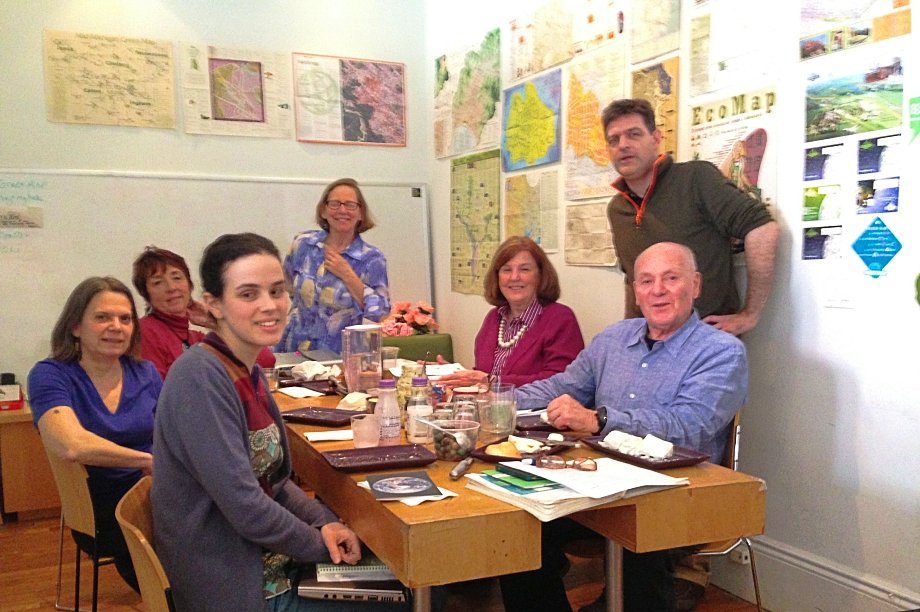
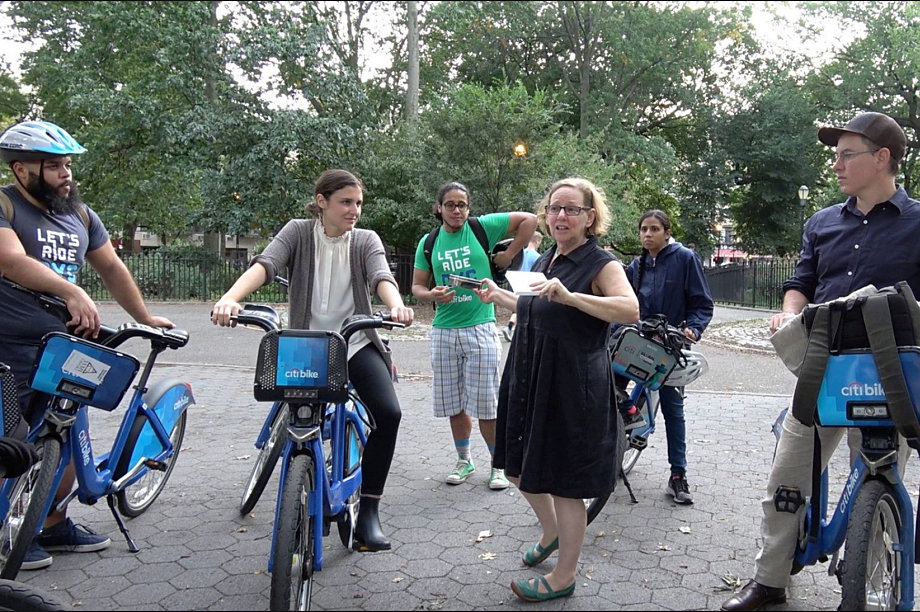
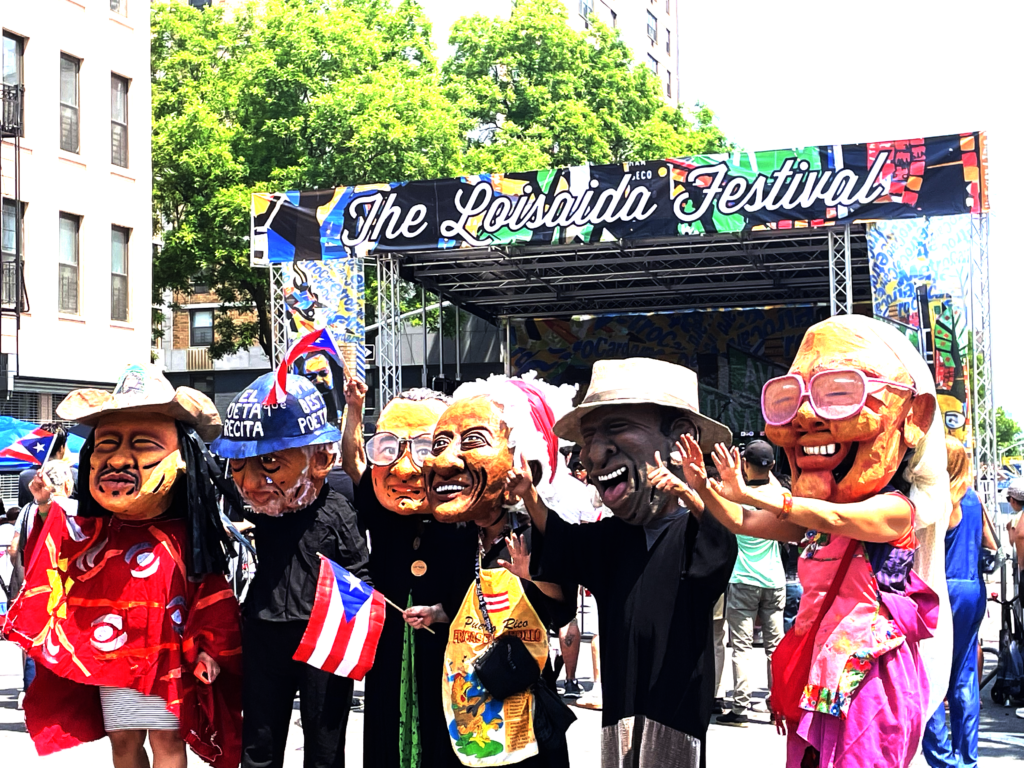
In our last report, we invited you to come and make a Green Map of the emerging Avenue C Cultural Corridor with our director and anthropologist Lyn Pentecost, cofounder of La Sala de Pepe, a wonderful community music and photography space celebrating Latino culture. We planned a bilingual mapping tour which sold out on the Jane’s Walk calendar. However, there was a deluge, and the tour was completely rained out. Nonetheless, 20 people enjoyed the photos and videos we organized the day before, and shared during a lively session in the gallery, as noted here.
Right now, the Avenue C Cultural Corridor Green Map elevating foodways, gardens, arts and culture remains unfinished, but this is likely to change as we keep connecting with more of our neighbors on Avenue C. We’ll be adding more here as the story continues - we’re finding there are even more layers of cultural history to unfold! If you are in the city this weekend, on August 17th, La Sala de Pepe is hosting Sembrando Resistencias / Sowing Resistance, a series connecting the history of salsa and community gardens (details here). See you there!
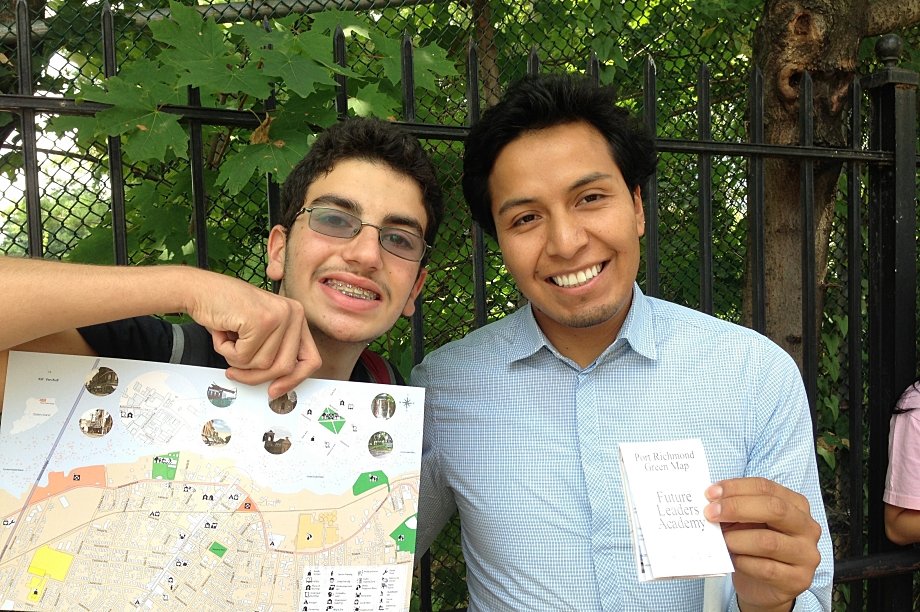
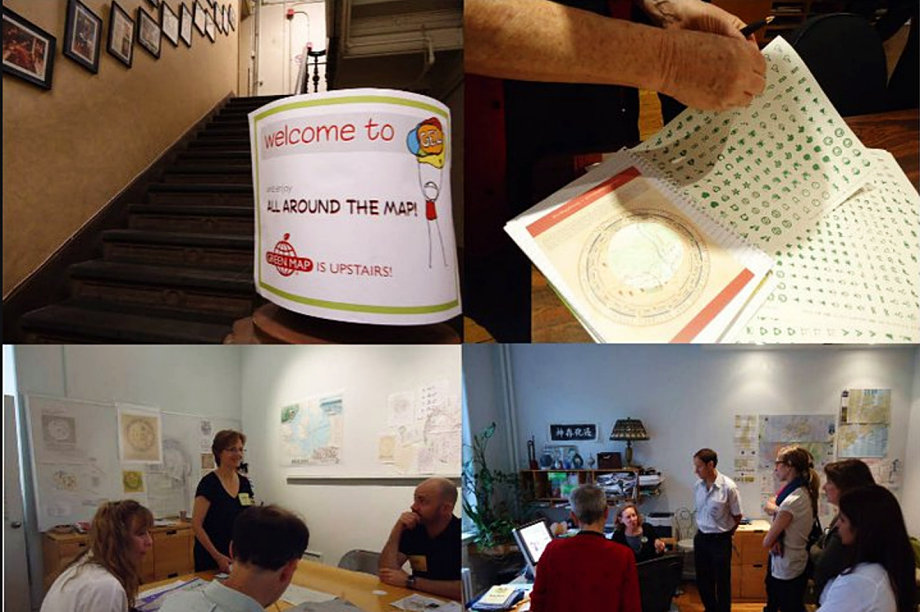
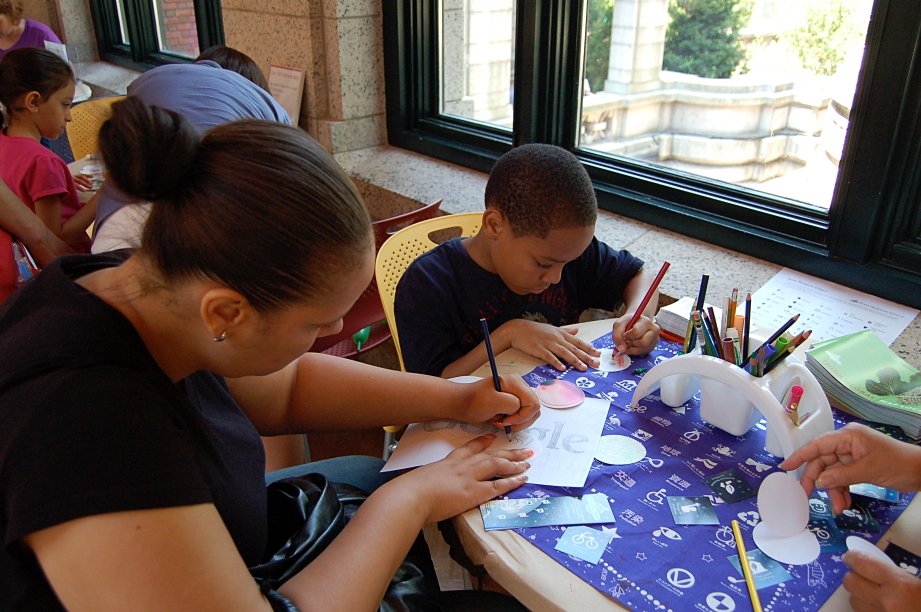
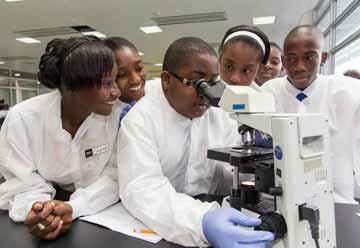
On the education front, we took part in the school science fair, Urban Advantage, at the American Museum of Natural History and Green Mapmaking is now in their widely-shared database. In planning how to activate these homeschooled kids, parents and teachers, we produced a new resource that can be used anywhere, a youth-oriented one page guide to our new mapping Platform. It’s designed to give newbie mappers a leg up, and reduce uncertainty about starting a new map. Find it on our resource page, GreenMap.org/resources/resources-and-tools. We proposed next year’s Urban Advantage participants use our tools to map all their projects, too.
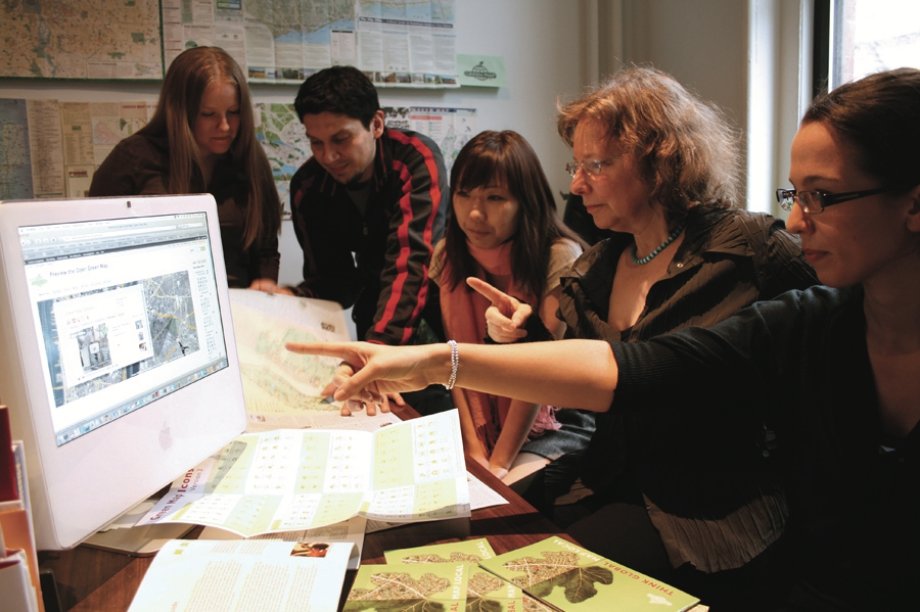
On the global side of Green Map - our new mapping platform has opened at GreenMap.org! We’re delighted to see so many new people using this versatile resource and its handy survey tools. It’s enabling people to quickly involve their neighbors in adding relevant sites to their Green Maps using handy Surveys. Explore the outcomes as a whole or through each map, as desired. More about this is in the latest report on GlobalGiving.
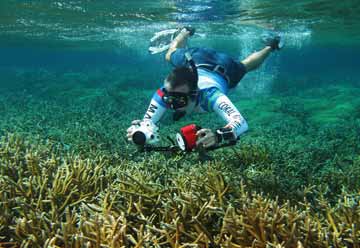
On July 22nd, we all experienced the hottest day on earth. We're looking ahead to September, which features Climate Week in NYC. We will send you an update soon with our local events, which will be produced with your support. Of course, we have one of our monthly Open Office Hours on September 4 (RSVP here), bring your ideas and questions about making a Green Map!
See you there!
Project reports on GlobalGiving are posted directly to globalgiving.org by Project Leaders as they are completed, generally every 3-4 months. To protect the integrity of these documents, GlobalGiving does not alter them; therefore you may find some language or formatting issues.
If you donate to this project or have donated to this project, you can receive an email when this project posts a report. You can also subscribe for reports without donating.
Support this important cause by creating a personalized fundraising page.
Start a Fundraiser